


INTRODUCTION
Although gastrectomy is considered the most effective treatment for potentially curable gastric cancer, its role is limited by the high morbidity and mortality following resection. Therefore, novel biomarkers that accurately predict recurrence and survival could provide clinicians with useful preoperative information to improve surgical outcomes.
The tumor-node-metastasis (TNM) staging system is considered the gold standard for prognostication in malignant tumors [1]. However, variable outcomes from the same tumor stage, and the inability to incorporate other variables are drawbacks [1,2]. Given the imperfections of the TNM system and dissatisfaction with biomarkers developed so far, more research is needed to establish simple but accurate new biomarkers.
Computed tomography (CT) scans has been considered the standard for evaluating the body composition, including muscle mass (i.e., muscle quantity) and muscle fat infiltration (i.e., muscle quality) [3]. Abdominal CT scans are most commonly preferred for body composition analysis [4], and the 3rd lumbar spine is considered the most common indicator [5]. The most common location for analysis is the total abdominal wall musculature (i.e., erector spinae, ES; multifidus, MF; quadratus lumborum, QL; psoas, PS. external obliques, internal obliques, transversus abdominis, and rectus abdominis), followed by the paraspinal muscles (i.e., ES, MF, QL, PS muscle).
Loss of muscle mass has a significant impact on cancer outcomes, including survival of cancer patients [6]. In a study by Shachar et al., low skeletal muscle index (SMI) was associated with worse survival in patients with gastrointestinal malignancies (hazard ratio, HR; 1.5 for gastroesophageal cancer and HR 2.2 for colorectal cancer) [7]. Similarly, in a study by Kuwada et al. [8], low preoperative SMI was a predictor of overall survival (OS) in most studies of gastric cancer. However, in Hacker et al.ãs studies involving gastric and gastroesophageal junction cancer, SMI was not a predictor of [9]. Therefore, prognostic role of SMI in gastrointestinal malignancies is unclear.
Muscle tissue usually contains only small amounts of fat, and when fat accumulates in excess, it is called myosteatosis. Advances in CT imaging techniques have enabled detailed analysis of muscle quality using muscle radiation attenuation (MRA) [10-12]. It has been reported that gastrointestinal cancer patients with myosteatosis have an increased mortality rate compared to those without [13,14].
The paraspinal muscles, stabilize the motion of spinal column, and the cross-sectional area of paraspinal muscle area (PMA) is related to the muscleãs ability to generate force. Several studies have reported the clinical role of the height-square-adjusted PMA, the paraspinal muscle index (PMI), in determining the survival of gastrointestinal malignancies [9, 15-17]. In the study of Hacker et al. [9], PMI of ES/MF/QL muscles was a predictor of OS, whereas PMI of PS muscles was not. In our previous studies, PMI of ES/MF/QL/PS muscles was not a predictor of OS [16,17]. Therefore, the clinical role of PMI in gastrointestinal malignancies is unclear as consensus has not been established. With respect to MRA of the paraspinal muscles (PMRA), few studies have investigated the clinical value of PMRA in patients with gastrointestinal malignancies [15-17]. In our previous studies, preoperative PMRA of ES/MF/QL/PS muscles was an important determinant of OS and disease-free survival (DFS) in gastric cancer patients [16,17]. However, further studies are needed to draw conclusions about the clinical significance of PMRA as a predictor of survival.
The ES/MF muscles are the posterior components of the paraspinal muscles. While the ES muscles are the major component of the paraspinal muscles and act as global mobilizers, the MF muscles act as local stabilizers. Compared to psoas muscle, which are rich in type II muscle fibers, the ES/MF muscles are primarily composed of type I muscle fibers, which are characterized by slower contractile rates and higher lipid content than Type II fibers [18]. Therefore, the body composition of the ES/MF muscle and its clinical significance may differ from that of the psoas muscle. In a study by Dohzono et al. [15], PMRA of ES/MF muscle (PMRAEM) was an important determinant of survival, whereas PMI of ES/MF muscle (PMIEM) was not. However, the clinical significance of PMIEM and PMRAEM in gastric cancer is unclear, as only advanced gastrointestinal malignancies, including 24% of gastric cancer, were included in the study [4].
Therefore, the purpose of this study is to investigate whether PMIEM and PMRAEM can predict the survival rate in patients with stage I to III gastric cancer that can be treated with gastrectomy. When PMIEM and PMRAEM are found to accurately predict patient recurrence and survival, their results can provide clinicians with useful preoperative information to improve surgical outcomes.
METHODS
1. Patients
We retrospectively evaluated patients who underwent gastrectomy for gastric cancer at a single university hospital between June 2006 and December 2017. The inclusion criteria were as follows: (i) primary gastric cancer [19]; (ii) stage I-III, according to the 8th edition of the American Joint Committee on cancer staging [20]; (iii) underwent microscopically margin-negative resection.
The exclusion criteria were as follows: (i) any malignancy within the last 5 years, or a second malignancy that occurred concurrently; (ii) received any anti-cancer therapy before surgery; (iii) severe infection within 4 weeks prior to surgery, active autoimmune disease, or positive for human immunodeficiency virus; (iv) undergoing surgical treatment for lumbar diseases; (v) non-Asian ethnicity; and (vi) chronic obstructive pulmonary disease (COPD) or chronic kidney disease (CKD) with glomerular filtration rate <30 mL/min (i.e., stage 4 or 5 CKD). The reason for excluding them is that sarcopenia has been reported to be found in nearly a quarter of patients with COPD [21] and about 30% of patients with stage IV or V CKD [12].
2. The baseline clinicopathologic characteristics
Records of clinicopathologic parameters (e.g., age, sex, body mass index, tumor site, tumor size, nodal invasion, TNM stage, types of gastrectomy (e.g., total gastrectomy and partial gastrectomy), Lauren histological classification [19], and perineural, lymphatic, and vascular invasion were collected for further analysis.
Blood tests included white blood cell count with differential count, hemoglobin concentration, platelet count, and serum albumin level. All blood samples were collected and processed according to local guidelines, including processing blood samples at room temperature within 1 hour after venipuncture. White blood cell count, hemoglobin concentration, and platelet count measurements were performed using an impedance counter LH 1502 (Beckman Coulter, Inc., Miami (Florida), United States). Blood test results were analyzed through tests performed within a week before surgery. If there are multiple test results, the test result closest to the date of surgery was selected for further analysis.
3. The muscle composition
After the landmark was identified at the 3rd lumbar (L3) level, the corresponding single unenhanced 2-dimensional CT image was extracted and saved [22]. The slice thickness was set at 5 mm. Only high-quality CT images taken at least 30 days prior to surgery were included in the analysis. Muscle composition was measured on images delineating the ES/MF muscles at the L3 level. To measure PMA in the ES/MF muscles, the cross-sectional area of the ES/MF muscles was obtained after identifying muscle tissue using a Hounsfield unit (HU) threshold range of -29 to +150. The PMA in the ES/MF muscles was indexed to the height to obtain the PMIEM. The PMRAEM was measured using the same HU threshold range as above. The images were analyzed by one trained nurse using a semi-automated software program, SliceOmatic (Tomovision, Montreal, QC, Canada).
4. Statistical analysis
Clinicopathological characteristics were described as median and interquartile ranges, or numbers and percentages. OS was defined as the interval from the date of gastrectomy to the date of death from any cause. DFS was defined as the interval from the date of gastrectomy to the date of recurrence or death from any cause, whichever happened first. If the patient did not experience cancer recurrence or death from any cause, it was censored at the last follow-up.
The Cox regression analysis was used to determine HRs. Only variables with p<.05 in the univariate analysis were included in the multivariate Cox regression analysis. For the diagnosis of multicollinearity of the covariates, variance inflation factors (VIFs) were estimated.
The time-varying prognostic accuracy of the models over time was evaluated using time-dependent receiver operating characteristic (ROC) curve analysis. For this purpose, the time-dependent area under ROC curve [AUC (t)] of models for OS and DFS over 10 years was plotted using the incident/dynamic approach. In addition, AUC (t) of models for survival at 36 and 60 months was determined. Moreover, the integrated AUC (t) of the models (iAUC) was determined to get a concordance measure. Finally, the Harrellãs concordance index (c-index) was determined to evaluate the discriminative capacity of the model [23,24].
Nomograms were constructed to predict the 3- and 5-year OS and DFS for patients with gastric cancer. Then, the nomograms were validated by using calibration curves.
All p-values presented were 2-sided, and statistical significance was declared at p<.05. Statistical analyses were performed using the R software and the MedCalcôÛ Statistical Software version 20 (MedCalc Software Ltd, Ostend, Belgium).
The study protocol was approved by the institutional review board (No. 2021-05-027). Because this study was a retrospective study, written consent was waived. This study was conducted in accordance with the ethical principles of the Declaration of Helsinki.
RESULTS
1. Clinicopathologic characteristics of patients
The patient characteristics are shown in Table 1. The median age of the patients was 60.5 years, with more men (66.2%) than women. Thirty-six patients (9.6%) fell into the category of early onset (i.e., less than 45 years) gastric cancer. There were 229 (60.9%) patients in stage I, 68 (18.1%) in stage II, and 79 (21.0%) in stage III. Perineural invasion was found in 32 (8.5%) patients. Anemia was diagnosed in 142 (37.8%) patients, whereas 29 (7.7%) had hypoalbuminemia.
Tableô 1.
Characteristic of Patients
| Variables | Median (IQR): or n (%) |
|---|---|
|
|
|
| Age (yr) | 60.5 (52.0-70.0) |
| Gender | |
| Men | 249 (66.2) |
| Women | 127 (33.8) |
| BMI (kg/m2) | 23.6 (21.3-25.8) |
| Site of tumor | |
| Upper | 38 (10.1) |
| Middle | 154 (41.0) |
| Lower | 179 (47.6) |
| Diffuse | 5 (1.3) |
| Size of tumor (cm) | 3.0 (2.0-5.5) |
| Nodal invasion | |
| No | 243 (64.6) |
| Yes | 133 (35.4) |
| TNM stage | |
| I | 229 (60.9) |
| II | 68 (18.1) |
| III | 79 (21.0) |
| Gastrectomy | |
| Partial | 297 (79.0) |
| Total | 79 (21.0) |
| Lauren classification | |
| Intestinal | 184 (48.9) |
| Diffuse | 92 (24.5) |
| Mixed | 85 (22.6) |
| Unknown | 15 (4.0) |
| Perineural invasion | |
| No | 344 (91.5) |
| Yes | 32 (8.5) |
| Lymphatic invasion | |
| No | 248 (66.0) |
| Yes | 128 (34.0) |
| Vascular invasion | |
| No | 357 (94.9) |
| Yes | 19 (5.1) |
| WBC (per ö¥L) | 6,500 (5,400-7,800) |
| Anemiaã | |
| No | 234 (62.2) |
| Yes | 142 (37.8) |
| Platelet (103/ö¥L) | 235 (203-279) |
| Serum albumin (g/dL) | 4.1 (3.9-4.3) |
| Adjuvant chemotherapy | |
| No | 240 (63.8) |
| Yes | 136 (36.2) |
2. Impact of PMIEM and PMRAEM on survival
Medians of PMIEM and PMRAEM were significantly different by gender (p<.001 for both variables), so they were dichotomized by gender. Using ROC curve analysis, the threshold values of PMIEM were 17.73 cm2/m2 for men and 17.51 cm2/m2 for women. In addition, the threshold values of PMRAEM were 40.15 HU for men and 36.16 HU for women (Figure S1). The number of patients below the PMIEM and PMRAEM thresholds was 215 (57.2%) and 170 (45.2%), respectively.
Figureô S1.
The cutoff points for paraspinal muscle parameters according to sex. (1-A) PMIEM in male (cutoff point 17.73 cm2/m2), (1-B) PMIEM in female (cutoff point 17.51 cm2/m2), (1-C) PMRAEM in male (cutoff point 40.15 HU), and (1-D) PMRAEM in female (cutoff point 36.16 HU). PMIEM=Paraspinal muscle in the erector spinae/multifidus muscles; PMRAEM=Paraspinal muscle radiation attenuations in the erector spinae/multifidus muscles. The numbers in parentheses next to the cutoff point indicate specificity and sensitivity, in order.
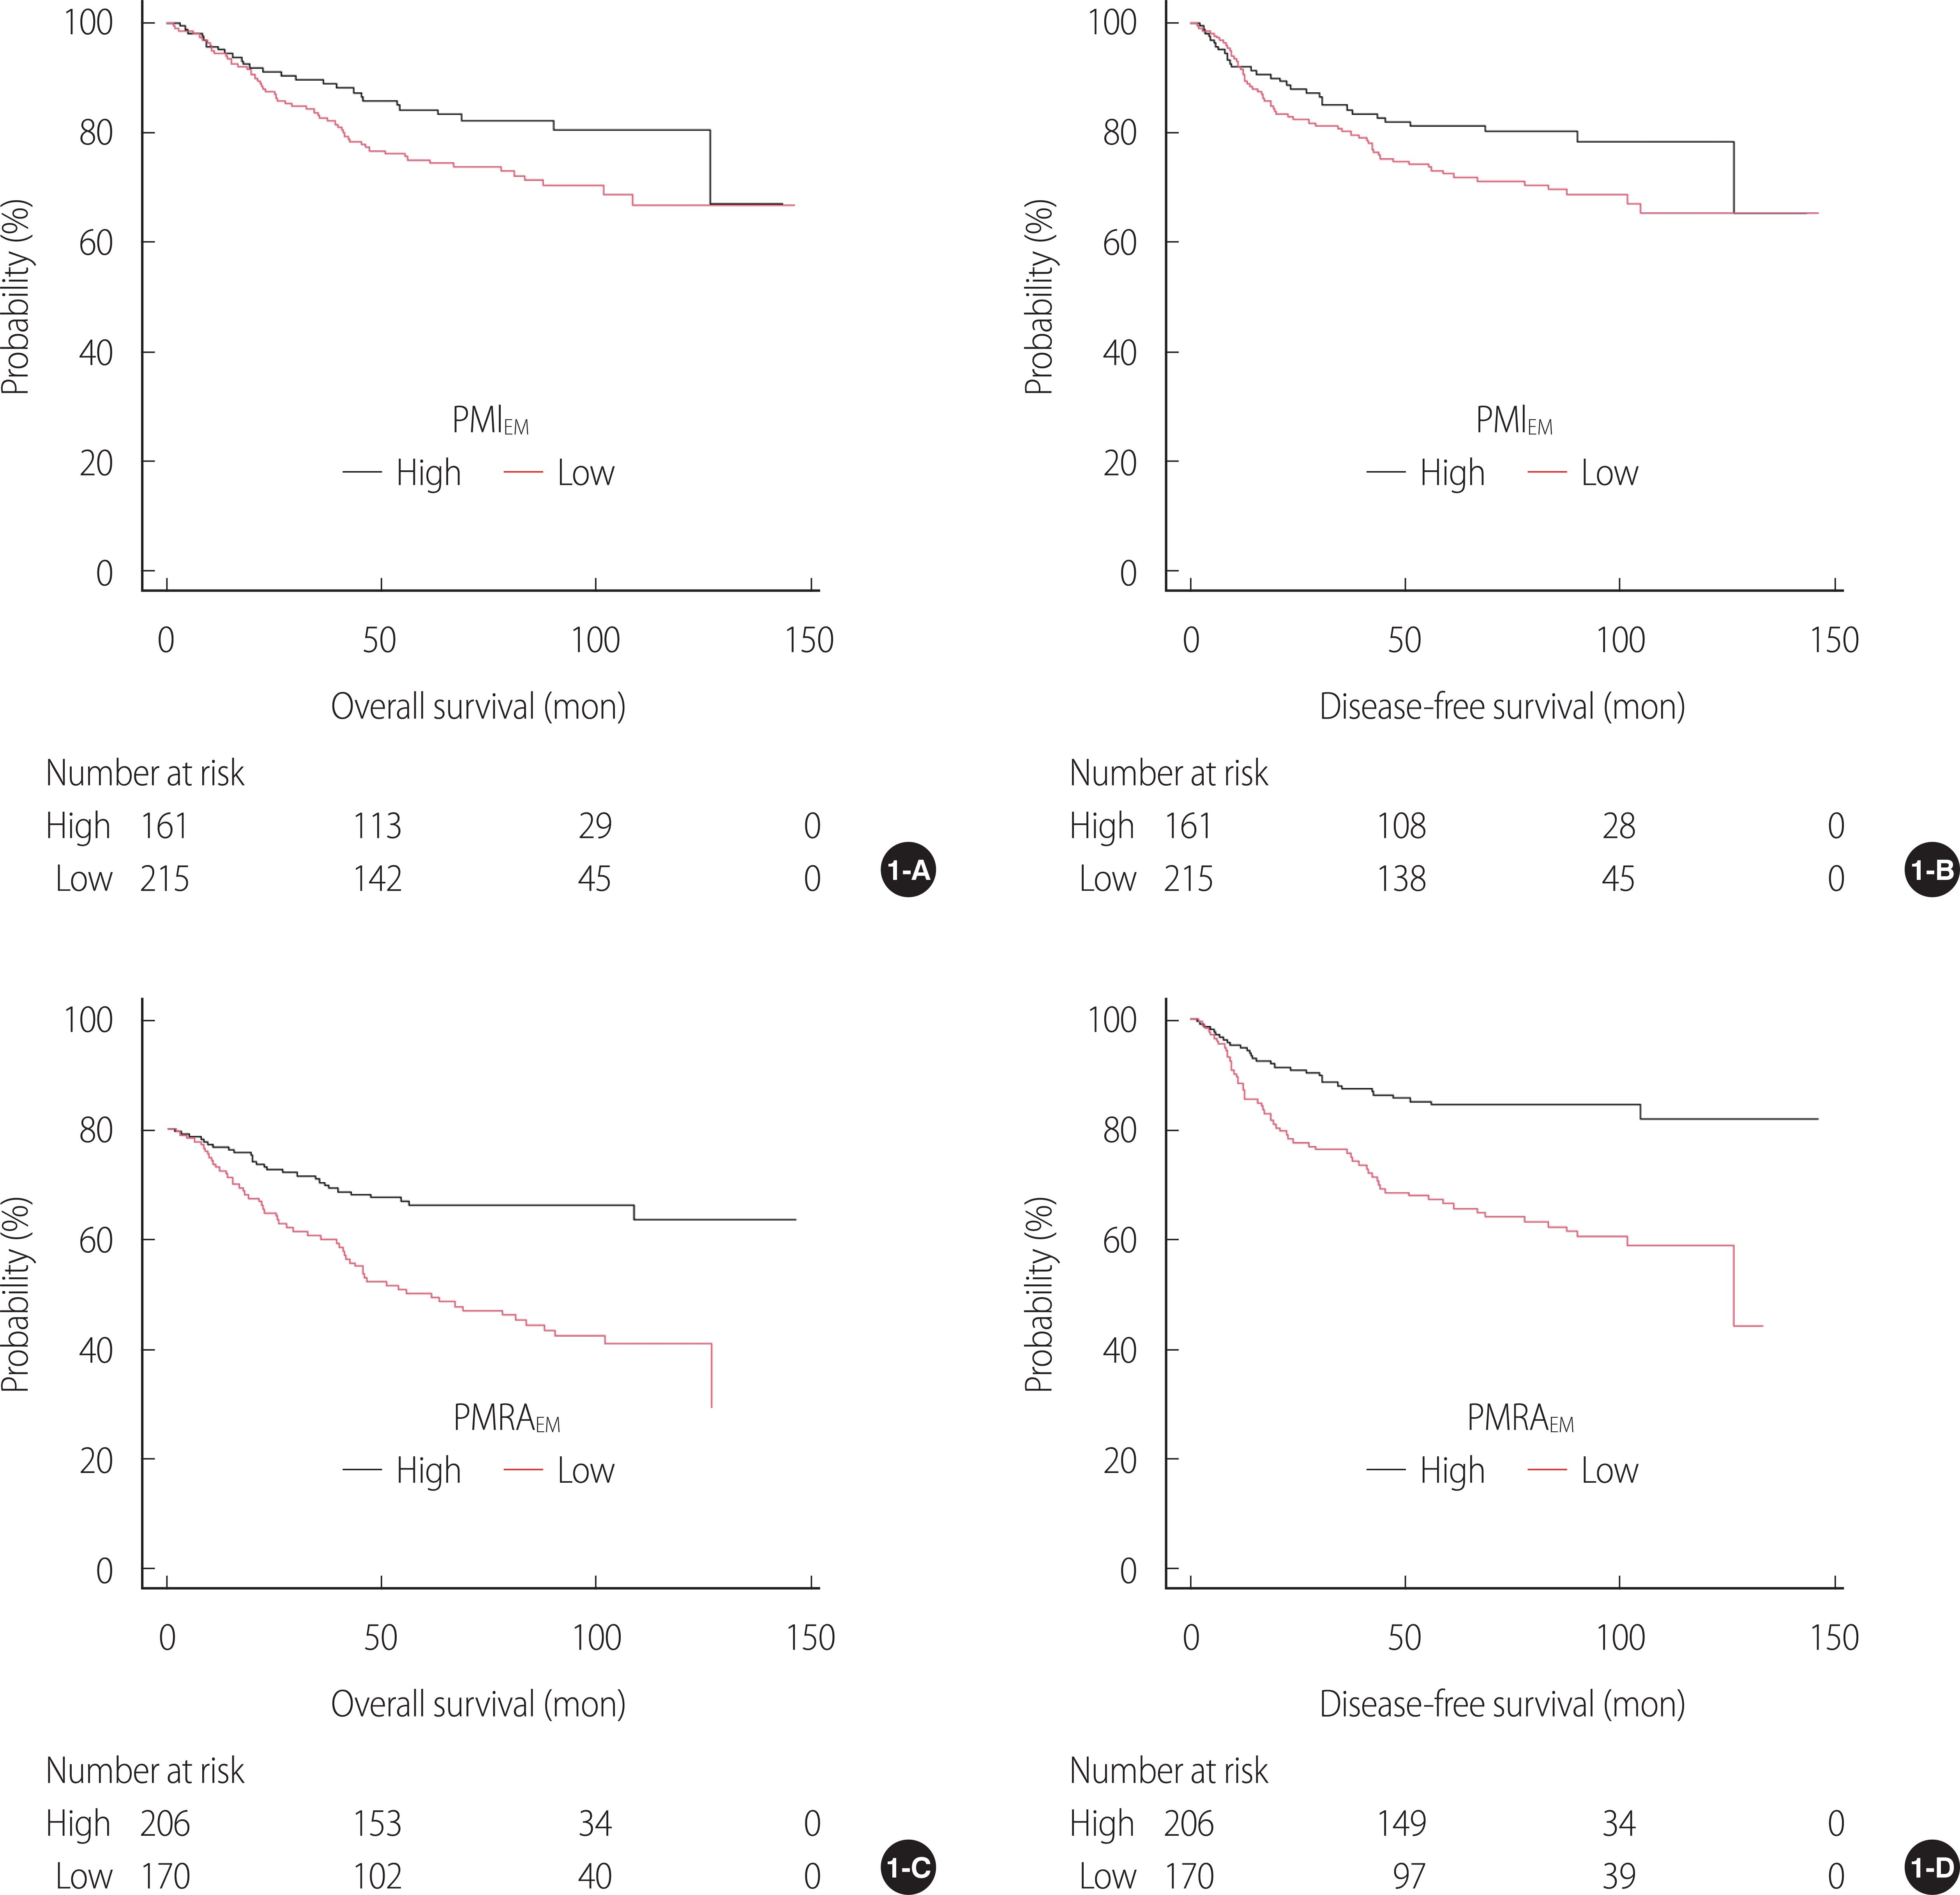
According to PMIEM, there was a significant difference in OS (p=.040), but not in DFS (p=.057) (Figure 1-A, 1-B). However, according to PMRAEM, there were significant differences in OS (p<.001) and DFS (p<.001) (Figure 1-C, 1-D).
Figureô 1.
Kaplan-Meier analyses of the survivals. (1-A) OS by PMIEM, (1-B) DFS by PMIEM, (1-C) OS by PMRAEM, and (1-D) DFS by PMRAEM.DFS=Disease-free survival; OS=Overall survival; PMRAEM=Paraspinal muscle radiation attenuation in the erector spinae/multifidus muscles; PMIEM=Paraspinal muscle index in the erector spinae/multifidus muscles.
Multivariate Cox regression analysis for both OS and DFS showed that PMRAEM along with age, TNM stage, perineural invasion, and serum albumin level were significant covariates (Table 2). Although PMRAEM was an important determinant of survival, PMIEM was not. There were weak correlations between PMIEM and PMRAEM (r=.28), and between serum albumin level and PMIEM (r=.17) or PMRAEM (r=.23) (Figure S2).
Tableô 2.
Cox P roportional Hazards Regression Analysis of Overall Survival and Disease-free Survival
| Variable | Overall survival | Disease-free survival | ||||||
|---|---|---|---|---|---|---|---|---|
|
|
|
|||||||
| Univariate | Multivariate | Univariate | Multivariate | |||||
|
|
|
|
|
|||||
| HR (95% CI) | p-value | HR (95% CI) | p-value | HR (95% CI) | p-value | HR (95% CI) | p-value | |
|
|
||||||||
| Age (yr) (ãË65 vs. <65) | 2.90 (1.86-4.51) | <.001 | 2.96 (1.86-4.71) | <.001 | 2.74 (1.80-4.16) | <.001 | 2.64 (1.70-4.12) | <.001 |
| Gender (women vs. men) | 0.76 (0.48-1.22) | .257 | 0.66 (0.42-1.04) | .075 | ||||
| BMI (kg/m2) | 0.94 (0.88-1.01) | .076 | 0.95 (0.89-1.01) | .099 | ||||
| Size of tumor (cm) | 1.18 (1.13-1.24) | <.001 | 1.19 (1.14-1.24) | <.001 | ||||
| TNM stage (III vs. I/II) | 5.64 (3.66-8.68) | <.001 | 4.11 (2.61-6.49) | <.001 | 6.23 (4.13-9.41) | <.001 | 4.78 (3.09-7.39) | <.001 |
| Nodal invasion (yes vs. no) | 3.63 (2.33-5.64) | <.001 | 4.04 (2.64-6.17) | <.001 | ||||
| Histology (intestinal vs. others)ã | 0.87 (0.57-1.34) | .527 | 0.91 (0.61-1.37) | .654 | ||||
| Perineural invasion (yes vs. no) | 2.69 (1.48-4.88) | .001 | 2.64 (1.38-5.07) | .004 | 2.59 (1.46-4.59) | .001 | 2.41 (1.28-4.52) | .006 |
| Lymphatic invasion (yes vs. no) | 3.37 (2.18-5.21) | <.001 | 3.42 (2.26-5.17) | <.001 | ||||
| Vascular invasion (yes vs. no) | 3.57 (1.84-6.93) | <.001 | 4.38 (2.38-8.05) | <.001 | ||||
| Anemia (yes vs. no)ãÀ | 3.17 (2.04-4.91) | <.001 | 3.12 (2.06-4.73) | <.001 | ||||
| Albumin (g/dL) (<3.5 vs. ãË3.5) | 7.03 (4.22-11.70) | <.001 | 4.94 (2.91-8.38) | <.001 | 6.69 (4.07-10.96) | <.001 | 4.33 (2.59-7.23) | <.001 |
| PMIEM (high vs. low) | 0.62 (0.39-0.98) | .042 | 0.66 (0.43-1.02) | .058 | ||||
| PMRAEM (high vs. low) | 0.36 (0.23-0.57) | <.001 | 0.48 (0.30-0.77) | .002 | 0.38 (0.24-0.58) | <.001 | 0.49 (0.31-0.76) | .001 |
Figureô S2.
Correlation coefficients between serum albumin levels and paraspinal muscle parameters. PMIEM=Paraspinal muscle in the erector spinae/multifidus muscles (PMIEM); PMRAEM=Paraspinal muscle radiation attenuation in the erector spinae/multifidus muscles (PMRAEM). The number in the box represents the correlation coefficient (r).
3. Establishment and validation of the model for survival
In the present study, five covariates derived from multivariate Cox regression analysis (i.e., PMRAEM along with age, TNM stage, perineural invasion, and serum albumin level) constituted Model 1. To compare the influence of models on the discriminatory power of iAUC or c-index, two nested models such as Model 2 (consisting of the same covariates as Model 1 except PMRAEM) and Model 3 (consisting of only TNM stage) were set [1].
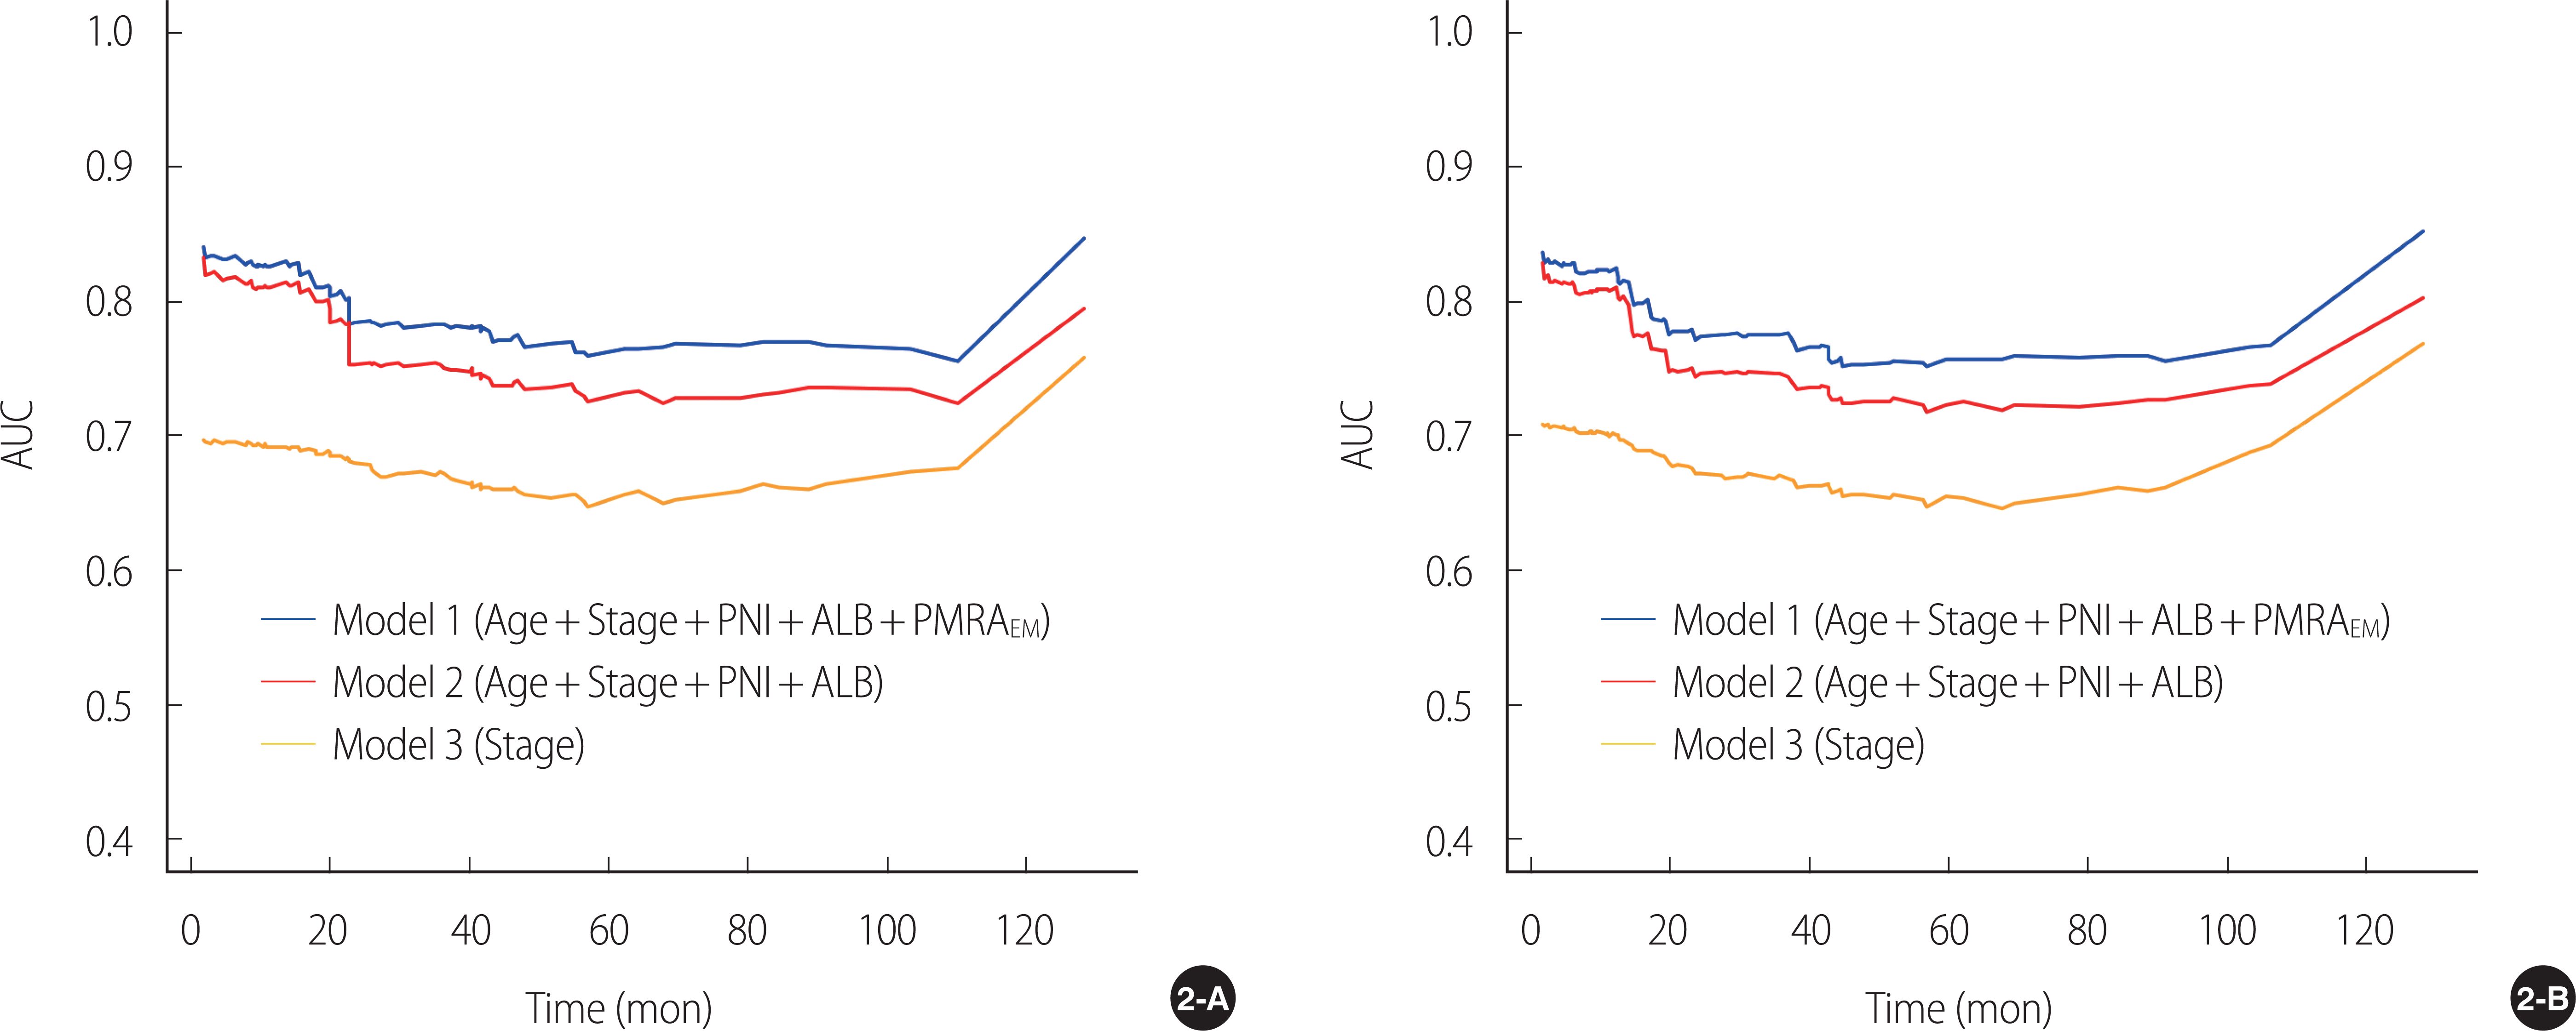
The iAUCs of Model 1, Model 2, and Model 3 for OS were 0.80, 0.77, and 0.68, respectively. Similarly, the iAUCs of Model 1, Model 2, and Model 3 for DFS were 0.79, 0.77, and 0.68, respectively (Table 3). The AUC (t) of Model 1 determining OS and DFS was higher than the AUC (t) of Model 2 or Model 3 over a 10-year period (Figure 2). The AUC (t) s of Model 1 for OS and DFS at the time points of interest (i.e., 36 and 60 months) were greater than that of Model 2 or Model 3 (Table 3).
Tableô 3.
Evaluation of Model 1 against Model 2 and Model 3
| Models | OS | DFS | ||||||||
|---|---|---|---|---|---|---|---|---|---|---|
|
|
|
|||||||||
| iAUC | AUC 36 | AUC 60 | c-index | iAUC | AUC 36 | AUC 60 | c-index | |||
|
|
|
|||||||||
| Con | p | Con | p | |||||||
|
|
||||||||||
| Model 1 | .80 | .78 | .76 | .82 | .79 | .77 | .75 | .82 | ||
| Model 2 | .77 | .75 | .73 | .81 | .131ã | .77 | .74 | .72 | .80 | .227ã |
| Model 3 | .68 | .67 | .69 | .69 | <.001ã | .68 | .65 | .65 | .70 | <.001ã |
AUC=Area under receiver operating characteristic curve; AUC 36=AUC at 36 months; AUC 60=AUC at 60 months; c-index=Harrellãs concordance index; Con=concordance; iAUC=Integrated AUC; Model 1=Five covariates (i.e., age, stage, perineural invasion, serum albumin level, and PMRAEM); Model 2=Four covariates (i.e., age, stage, perineural invasion, and serum albumin level); Model 3=Stage; OS=Overall survival; PMRAEM=Paraspinal muscle radiation attenuation in the erector spinae/multifidus muscles; DFS=Disease-free survival.
Figureô 2.
Time-varying prognostic accuracy of models over time using the incident/dynamic approach, with respect to time-dependent AUC. (2-A) overall survival; (2-B) disease-free survival. ALB=Serum albumin level; PMRAEM=Paraspinal muscle radiation attenuation in the erector spinae/multifidus muscles; PNI=Perineural invasion; Stage=Tumor-Node-Metastasis stage; AUC=Area under receiver operating characteristic curve.
The c-indices of Model 1, Model 2, and Model 3 for OS were 0.82, 0.81, and 0.69, respectively. Similarly, the c-indices of Model 1, Model 2, and Model 3 for DFS were 0.82, 0.80, and 0.70, respectively. When comparing the c-index, there was a significant difference between Model 1 and Model 3 (p<.001), but no significant difference was found between Model 1 and Model 2 (Table 3).
Finally, using Model 1, we established nomograms that predict 3-year and 5-year OS and DFS in patients with gastric cancer who underwent gastrectomy (Figure S3). The established nomogram was validated using calibration curves (Figure S4). Given the gray dotted diagonal lines representing the ideal situation, the predicted survival closely matches the actual survival (i.e., OS and DFS). Although TNM stage and serum albumin levels comprised a large portion of the total scores in the nomogram, patients with low PMRAEM also scored about 50, highlighting their clinical value as a survival predictor.
Figureô S3.
Nomograms predicting 3-year and 5-year survival after surgical resection of gastric cancer. (3-A) overall survival, and (3-B) disease-free survival. PNI=perineural invasion; PMRAEM=Paraspinal muscle radiation attenuation in the erector spinae/multifidus muscles (PMRAEM).
Figureô S4.
Calibration curves predicting survival. (4-A) 3-year OS, (4-B) 5-year OS, (4-C) 3-year DFS, and (4-D) 5-year DFS. The x-axis represents nomogram-predicted survival; the y-axis represents actual survival and 95% confidence intervals. OS=Overall survival; DFS, Disease-free survival.
DISCUSSION
In the present study, PMRAEM was an independent predictor of survival. The five covariates derived from multivariate Cox regression analysis (i.e., PMRAEM along with age, TNM stage, perineural invasion, and serum albumin level) constituted Model 1. The iAUC and c-index of Model 1 for OS and DFS were higher than those of the nested models (i.e., Model 2 or Model 3).
CT scans has been considered the standard for evaluating the body composition. Because CT scans are a key imaging test for assessing and monitoring cancer staging and response in most cancer patients, studies of body composition determination in cancer patients have the advantage of avoiding additional radiation exposure [3]. For analysis of body composition using CT scan, abdominal CT scans are most commonly preferred because of the relatively large amount of image data available for retrospective review [4]. L3 levels in the abdomen are the most attractive landmarks for study [5]. The most frequent regions of interest in the abdomen have been the total abdominal wall musculature followed by paraspinal muscles.
Muscle tissue usually contains only small amounts of fat, and when fat accumulates in excess, it is called myosteatosis. The gold standard for analyzing muscle adipose tissue infiltration is the biopsy. However, advances in CT imaging have enabled increasingly detailed analysis of muscle qualities using MRA in HU [10-12]. For measuring MRA, however, a specialized software to analyze CT images is required and can be expensive. In addition, measurement training is required as most software is not fully automatic. Finally, cutoff points to define low MRA are different according to gender, and they are diverse depending on the studies.
Recently, the clinical significance of muscle fat content in malignancies has been reported in the form of a systemic review. In a study by Aleixo et al., cancer patients with myosteatosis had an increased mortality (HR 1.75) compared to cancer patients without [14]. In another study limited to gastrointestinal tumors, only patients with esophageal gastric cancer, cholangiocarcinoma, pancreatic cancer, and colorectal cancer had a higher mortality rate in patients with myosteatosis than in patients without myosteatosis [13]. These findings, like ours, underscore the clinical importance of muscle fat content in gastric cancer.
In our previous reports, we also found that MRA of paraspinal muscles were significant prognostic factor for survival in patient with gastric cancer undergoing curative gastrectomy [16,17]. In particular, the c-index of the model including only paraspinal muscles was greater than the model including the total abdominal wall musculature. Considering that the paraspinal muscles are a small component of the total abdominal wall musculature, this result may give hope that the measurement time can be saved without compromising the accuracy of the measurement [17].
These previous findings raised the question of whether body composition localized to the ES/MF muscle, a small component of the paraspinal muscle composed of type I muscle fibers, could be a radiological indicator of survival [18]. Accordingly, we carried out this study, which measures body composition localized to ES/MF muscles at the L3 level.
Using the multivariate Cox model, patients with high PMRAEM had a significantly lower risk in terms of OS (HR 0.48) and DFS (HR 0.49) compared to patients with low PMRAEM, highlighting the clinical significance of PMRAEM. In this study, while PMRAEM was an important determinant of survival, PMIEM was not, which is consistent with a previous study by Dohzono et al. [15], although there are some differences between them, including cutoffs, histology (gastric cancer vs. gastrointestinal malignancies including gastric cancer at 24%), and tumor stage (stage I-III vs. advanced stage). Therefore, in gastrointestinal malignancies, muscle quality (i.e., PMRAEM) rather than muscle mass (i.e., PMIEM) may play an important factor for survival. Since there was only a weak correlation between PMIEM and PMRAEM in this study (r=.28), it is presumed that muscle mass and quality may be mutually exclusive.
Several trials have demonstrated that early intervention has the potential to delay or prevent myosteatosis [13]. In people at risk for developing sarcopenia-related disorders, exercise may improve muscle quality by increasing the degree of MRA [10]. In addition, in the case of the elderly, when resistance exercise is resumed, the infiltration of muscle fat decreases [25]. Because there are no reports of the role of exercise in improving the prognosis of cancer patients with myosteatosis, studies on the efficacy of exercise training as a predictor of survival in these patients are needed.
The ROC curve is a tool for demonstrating the sensitivity of a continuous variable to 1-specificity for all possible values of a threshold [26], and classification accuracy is most often expressed using the AUC [26]. Because disease outcomes are time-dependent in many occasions, the time-dependent ROC curves of the models were used in this study to characterize the time-varying prognostic performance [27]. In this study, the iAUC of Model 1 for OS and DFS were significantly greater than that of Model 2 or Model 3. In addition, using the AUC (t)s of models over a 10-year period, Model 1 was higher than Model 2 or Model 3 in survival prediction. In addition to iAUC, the c-index is used to measure the discriminative ability of the model, with a larger c-index indicating a more accurate prognostic estimate [24]. In the current study, c-index of Model 1 was higher than that of Model 2 or Model 3. Overall, compared to the other nested models, the full model (i.e., Model 1) showed higher c-index, iAUC, 36-month AUC, and 60-month AUC, highlighting the prognostic importance of PMRAEM in Model 1.
Therefore, in this study, Model 1 was used to construct nomograms to accurately predict 3-year and 5-year OS and DFS. The established nomogram was internally validated using a calibration curve. In particular, patients with low PMRAEM scored approximately 50 points on the monogram, highlighting their clinical value as a predictor of survival. However, external validation is essential before applying Model 1 as a survival predictor in clinical practice. If this model is proven to accurately predict recurrence and survival, it could provide clinicians with useful preoperative information to improve surgical outcomes.
The strengths of the present study are as follows: First, to the best of our knowledge, this is the first report on the value of PMIEM and PMRAEM as determinants of survival in patients with stage I to III gastric cancer. Using multivariate Cox regression analysis, we found that PMRAEM rather than PMIEM appears a determinant of OS and DFS. Second, in this study, PMRAEM along with age, TNM stage, perineural invasion, and serum albumin level were significant covariates for both OS and DFS and constituted Model 1. Both iAUC and c-index of Model 1 had better discriminatory powers of survival than those of the nested models (i.e., Model 2 or Model 3). The result was internally validated using a resampling technique. Third, a nomogram was constructed using Model 1, and verification using a calibration curve confirmed that the predicted survival rate was almost identical to the actual survival rate. Therefore, our findings could provide clinicians with useful preoperative information to improve surgical outcomes. Fourth, in this study, a CT image was extracted by a musculoskeletal radiologist, and one nurse trained in image analysis analyzed the extracted images using a semi-automatic software program. For consistency, the final image file containing the segmentation was double checked by the radiologist. Finally, the results of this study could be the basis for the beginning of the following studies to evaluate the effectiveness of rehabilitation therapy on the ES/MF muscles to improve long-term prognosis after gastrectomy.
However, this study has some limitations, so caution is needed in interpreting the results. First, since this study was conducted retrospectively, data omissions are inevitable, and this fact may have affected the results of this study. Second, since this study was conducted retrospectively, it was impossible to evaluate nutritional status of patients in detail except for body mass index and serum albumin levels, making it difficult to study the correlation between nutritional status and PMRAEM. Finally, although we controlled for random errors and potential biases and performed internal validation, the absence of external validation was another limitation of this study.
CONCLUSION
Using a multivariate Cox model, PMRAEM was an important determinant of survival, however, PMIEM was not. Because there was only a weak correlation between PMIEM and PMRAEM in this study, it is presumed that they are mutually exclusive. In this study, PMRAEM along with age, TNM stage, perineural invasion, and serum albumin level were significant covariates for OS and DFS, and constituted Model 1. Both iAUC and c-index of Model 1 had better discriminatory powers of survival than those of the nested models (i.e., Model 2 or Model 3). A nomogram predicting survival rate was constructed using Model 1, and, by applying a calibration curve, the predicted survival was almost identical to the actual survival. In particular, patients with low PMRAEM scored approximately 50 points on the monogram, highlighting its clinical value as a predictor of survival. However, the clinical value of PMRAEM may have been underestimated because this study was conducted on a cohort of stage I to III gastric cancer patients with relatively good performance and nutritional status. Finally, because PMRAEM is a newly characterized survival determinant in patients with gastric cancer, its prognostic significance requires further validation before clinical application.
 PDF Links
 PubReader
 Full text via DOI
 Download Citation
 Supplement1
 Supplement2
 Supplement3
 Supplement4
 Print
Print